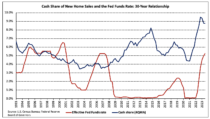
NAHB analysis of the most recent Quarterly Sales by Price and Financing report reveals that the all-cash share of new home sales climbed substantially in the third quarter of 2023 while VA-backed sales share fell by nearly half. Additionally, the median purchase price of homes bought with cash surged by one-third over the quarter.
After declining each of the two prior quarters, the share of cash purchases surged from an upwardly revised 7.1% of new home sales in Q2 to 9.2% in the third quarter of 2023. The 2.1 ppt quarterly increase—equal to the increases in Q3 2011 and Q2 2021—is tied for the largest since climbing 2.5 ppts to 6.7% in 2010.†
Over the 30-year period preceding the current, aggressive Federal Reserve rate hike cycle, the share of all-cash new home sales averaged 5.3%. In the seven quarters since, the share has averaged 8.9%. The chart below illustrates how much more pronounced the relationship between the all-cash share (four-quarter moving average) and the Federal Funds rate has become since 2017.

Although cash sales make up a small portion of new home sales, they constitute a larger share of existing home sales. According to estimates from the National Association of Realtors, 29% of existing home transactions were all-cash sales in September 2023, up from 27%% in August and 22% in September 2022.
Conventional loans financed 74.7% of new home sales, up 1.3 percentage points over the quarter but 1.5 ppts higher than the 2022 Q3 share. In contrast, the share of FHA-backed sales declined from 13.6% to 13.2%. Although this represents a 4.8 ppt increase over Q3 2022, it remains well below the post-Great Recession average of 17.0%.

The share of VA-backed sales fell by nearly half–declining from 6.0% to 3.4%, over the quarter—reaching the lowest share since 2007.
Price by Type of Financing
Different sources of financing also serve distinct market segments, which is revealed in part by the median new home price associated with each. In the third quarter, the national median sales price of a new home was $431,000. Split by types of financing, the median prices of new homes financed with conventional loans, FHA loans, VA loans, and cash were $466,600, $330,700, $373,000, and $486,800, respectively.
The purchase price of new homes declined over the past year regardless of means of financing, In contrast, the year-over-year change in median price varied greatly in both direction as well as magnitude. The median cash sales price surged 33.4% over the quarter while the price of FHA- and VA-backed sales both declined roughly five percent.

† Some caution should be exercised when interpreting both nominal as well as percentage changes in the all-cash and VA-backed share new home sales. The number of sales is small in historical terms relative to conventional loan and FHA-backed sales. This may result in higher volatility in the initially reported data and in the magnitude of revisions in percentage terms.
Discover more from Eye On Housing
Subscribe to get the latest posts sent to your email.


For the construction loan sector, this emphasizes the importance of flexible financing options. Developers may need to adapt their strategies to accommodate diverse buyer preferences, and construction loans could play a key role in meeting the evolving demands of a market where cash transactions are on the rise.