Trying to fill the void that was created in 2001 when the Residential Finance Survey (RFS) was discontinued, the US Census Bureau started collecting data on financial, physical and other characteristics of multifamily rental housing properties through its newly designed Rental Housing Finance Survey (RHFS). The first survey took place in 2012. The estimates are still under review by the Census Bureau and HUD. NAHB Economics has been evaluating the new data as well.
Unlike in all other existing housing surveys, the unit of reference in the RHFS is not a housing unit or person but rather a multifamily rental property. Almost two-thirds of these properties have only one building, the rest have two buildings or more. The RHFS separately identifies expenses on property maintenance and repair and capital expenses. The survey also reveals a year the oldest building was constructed and thus allows comparing expenses by property age.
Looking at properties with five or more units, the average spending on maintenance and repair in 2011 was $50,802. However, this average is skewed by a few large properties with much higher expenses. The median spending only reaches $11,559, meaning that half of all properties with 5+ units spend less than that amount. The capital expenses are even more influenced by a few outliers. The 2010-2011 average spending per property exceeds $152,000 but the median only reaches $14,800.
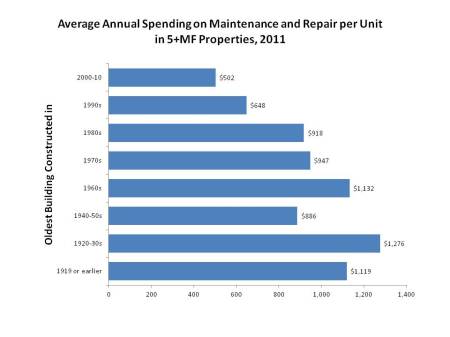
Since spending on maintenance and repair and capital expenses are highly influenced by the size of a property, it is more meaningful to compare these expenses on a per unit basis. Managers of properties with oldest buildings constructed in the 1920-30s report some of the highest annual spending on maintenance and repair per unit, close to $1,300 in 2011. Properties with oldest building constructed in the 1960s and before 1920 register maintenance spending that on average exceed $1,100 per unit. Newer properties with buildings constructed in the 2000s report lowest annual spending on maintenance and repair, around $500 per unit.

Comparing annual spending on maintenance and repair with the total rent collected during the same year delivers a slightly different ranking. Properties with the oldest buildings constructed in the 1970s register the highest maintenance and repair spending relative to rent, $229 per $1,000 of rent, on average. Properties with buildings built in the 1920-30s are close second with $220. As before, newer properties built in the 2000s report the lowest maintenance and repair spending relative to rent, $58 per $1,000 of collected rent, on average.

It might seem surprising that properties with oldest buildings constructed in the 1940-50s have maintenance expenses lower than properties with newer buildings constructed in the 1960s and 1970s. One possible explanation is that these properties have already undergone major capital renovations thus resulting in lower annual maintenance cost.

6 Responses
And the current economy has only strengthened the case for
multifamily investing. In mold remediation, ozone generators make use of what is
called “high ozone shock treatment. It is a process of studying and identifying reasons for the fungus growth and identifying remedial measures to curb the expansion of mold growth.