After four consecutive declines, the producer price index (PPI) for inputs to residential construction less energy (i.e., building materials) rose 0.3% in February 2023 (not seasonally adjusted) follow a 1.1% increase in January (revised), according to the latest PPI report.

Price growth of goods inputs to residential construction, including energy, gained 0.4% over the month. Prices have increased 2.9% over the past 12 months.
Ready-Mix Concrete
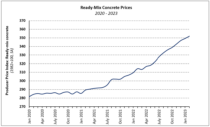
The trend of ready-mix concrete (RMC) prices continued its historic pace as the index increased 0.8% in February after gaining 0.7% in January (revised). RMC prices have increase in all but two months since January 2021.

The monthly increase in the national data was broad-based geographically but was primarily driven by a 4.2% increase in the Northeast. Prices 0.8% in the West, 0.5% in the South, and were unchanged in the Midwest.

Softwood Lumber
The PPI for softwood lumber (seasonally adjusted) fell 0.8% in February–the seventh consecutive monthly decline. Since peaking in March 2022, the index has fallen by nearly half (-47.1%) but is still nearly 20% above the January 2020 level.

Gypsum Building Materials
The PPI for gypsum building materials climbed 0.5% in February after edging down very slightly the month prior. Gypsum products prices are 12.5% higher than they were a year ago but began stabilizing in August 2022. Prices have been stable—up just 0.7%–in the six months since.

Steel Mill Products
Steel mill products prices increased 2.6% in February, more than offsetting the 2.4% decline seen the month prior. This was the first monthly price increase since May 2022. Even so, prices have dropped 26.0% since May 2022 and are down 21.2% over the past 12 months.
Services
The price index of services inputs to residential construction rose 0.2% in February following a 0.7% increase in January. Prices have declined 7.7% over the past year despite increasing in four of the past five months.

Transportation of Freight
The price of truck, deep sea (i.e., ocean), and rail transportation of freight decreased 0.8%, 0.5% and 1.1%, respectively, in February. Of the three modes of shipping, trucking prices have exhibited the largest slowdown since early 2022.

Discover more from Eye On Housing
Subscribe to get the latest posts to your email.


Regarding the 2nd and 3rd graphs, the axis appear the same, but the data is much different. Can you explain the differences between these two graphs?
I’m interested in the price of ready mix concrete overall and the regional price.
Thank you in advance.