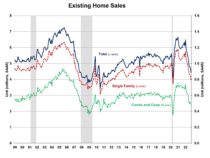
As higher mortgage rates continue to weaken housing demand, the volume of existing home sales has declined for nine consecutive months as of October, according to the National Association of Realtors (NAR). This is the longest run of declines since 1999. The average 30-year fixed mortgage interest rate increased from 3.11% at the start of the year to 6.61% this week, making housing less affordable. However, home price appreciation slowed for the fourth month after reaching a record high of $413,800 in June.
Total existing home sales, including single-family homes, townhomes, condominiums and co-ops, fell 5.9% to a seasonally adjusted annual rate of 4.43 million in October, the lowest pace since December 2011 with the exception of April and May 2020. On a year-over-year basis, sales were 28.4% lower than a year ago.
The first-time buyer share stayed at 28% in October, down from 29% in both September 2022 and October 2021. The October inventory level fell from 1.23 to 1.22 million units and was down from 1.23 million a year ago.
At the current sales rate, October unsold inventory sits at a 3.3-month supply, higher from 3.1-months last month and 2.4-months reading a year ago.
Homes stayed on the market for an average of 21 days in October, up from 19 days in September and 18 days in October 2021. In October, 64% of homes sold were on the market for less than a month.
The October all-cash sales share was 26% of transactions, up from 22% last month and 24% a year ago.
The October median sales price of all existing homes was $379,100, up 6.6% from a year ago, representing the 128th consecutive month of year-over-year increases, the longest-running streak on record. The median existing condominium/co-op price of $331,000 in October was up 10.1% from a year ago.
Geographically, sales in all four regions dropped in October, ranging from 4.8% in the South to 9.1% in the West. On a year-over-year basis, all four regions saw a double-digit decline in sales, ranging from 23.0% in the Northeast to 37.5% in the West.
The Pending Home Sales Index (PHSI) is a forward-looking indicator based on signed contracts. The PHSI fell 10.2% from 88.5 to 79.5 in September. On a year-over-year basis, pending sales were 31.0% lower than a year ago per the NAR data.
Discover more from Eye On Housing
Subscribe to get the latest posts sent to your email.


