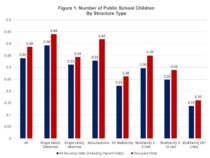
Public education accounts for almost 40% of local government direct expenditures per housing unit, based on data from the Census of Government. School impact fees on new construction are typically determined in part by assumptions about the number of children in public schools per housing unit. The most recent 2018 American Community Survey (ACS) data show that, on average, there is approximately one public school child for every three housing units in the U.S.
The average across all housing units in the U.S. (including both occupied and vacant ones) is 0.34 per housing unit. That is a little over one public school child for ever three homes. Among all structure types, single-family detached housing has the highest average number per unit (0.39), followed by manufactured housing (0.33), single-family attached (0.31), and multifamily (0.22). Larger multifamily properties have fewer public school children per unit. This number is only 0.14 per unit for multifamily buildings with 20 or more units, compared to 0.25 per unit for buildings with 5-19 units, and 0.30 for 2 – 4 unit buildings (Figure 1).
If vacant units are excluded, the average number of public school children per occupied unit will be slightly higher by definition: 0.39 across all structure types. The averages are 0.44 public school child per occupied unit for single-family detached, 0.34 per occupied unit for single-family attached, 0.42 for manufactured housing and 0.26 for multifamily.
The 2018 ACS data show that owner-occupied units have fewer public school children than renter-occupied units for all structure types. Figure 2 shows that, on average, there is 0.38 public school children per owner-occupied unit and 0.41 per renter-occupied unit.
In general, new homes (built in 2017 or 2018), have slightly fewer children attending public schools than existing homes, built before 2017 (Figure 3). Only 0.32 public school children per new construction, compared to 0.34 per existing home. Among all new construction, single-family detached homes have the largest average number per unit (0.43), followed by manufactured housing (0.34), single-family attached (0.21), and multifamily (0.12).
On average, there are fewer public school children per recent mover household, living in the same unit for less than a year, than per non-mover household: 0.35 per mover household vs. 0.39 per non-mover household. For particular types of structures, however, the opposite is true. The only type of structure with fewer public school children per recent mover households is multifamily: 0.21 per recent mover household compared to 0.28 per non-mover. Figure 4 also shows there is one child attending public school for every two households who recently moved into single-family detached units, but only one for every five households moving into multifamily units.
The number of public school children in different types of homes, with separate statistics for recent movers and new construction, is available in the NAHB Special Study.
Discover more from Eye On Housing
Subscribe to get the latest posts sent to your email.


