The Census Bureau’s Quarterly Summary of State & Local Tax Revenue shows a 1.3% increase in property taxes paid, rising from $769.2 to $778.9 billion (SA, trailing four quarter sum) in the fourth quarter of 2023. Total annual state & local tax revenue was $2.039 trillion, also 1.3% higher than 2022.

The 1.3% quarterly increase in the fourth quarter property tax revenue was the smallest rise since the 0.8% increase in the third quarter of 2022. The previous three quarters of 2023 had percentage increases well above the 12-year average (1.0%) as they all increased by above 3.5% quarterly.

Year-over-year, property tax revenue was 12.5% higher. While a slightly lower increase than the previous quarter, the fourth quarter year-over-year increase remained well above the average yearly increase over the past 11 years (4.0%).

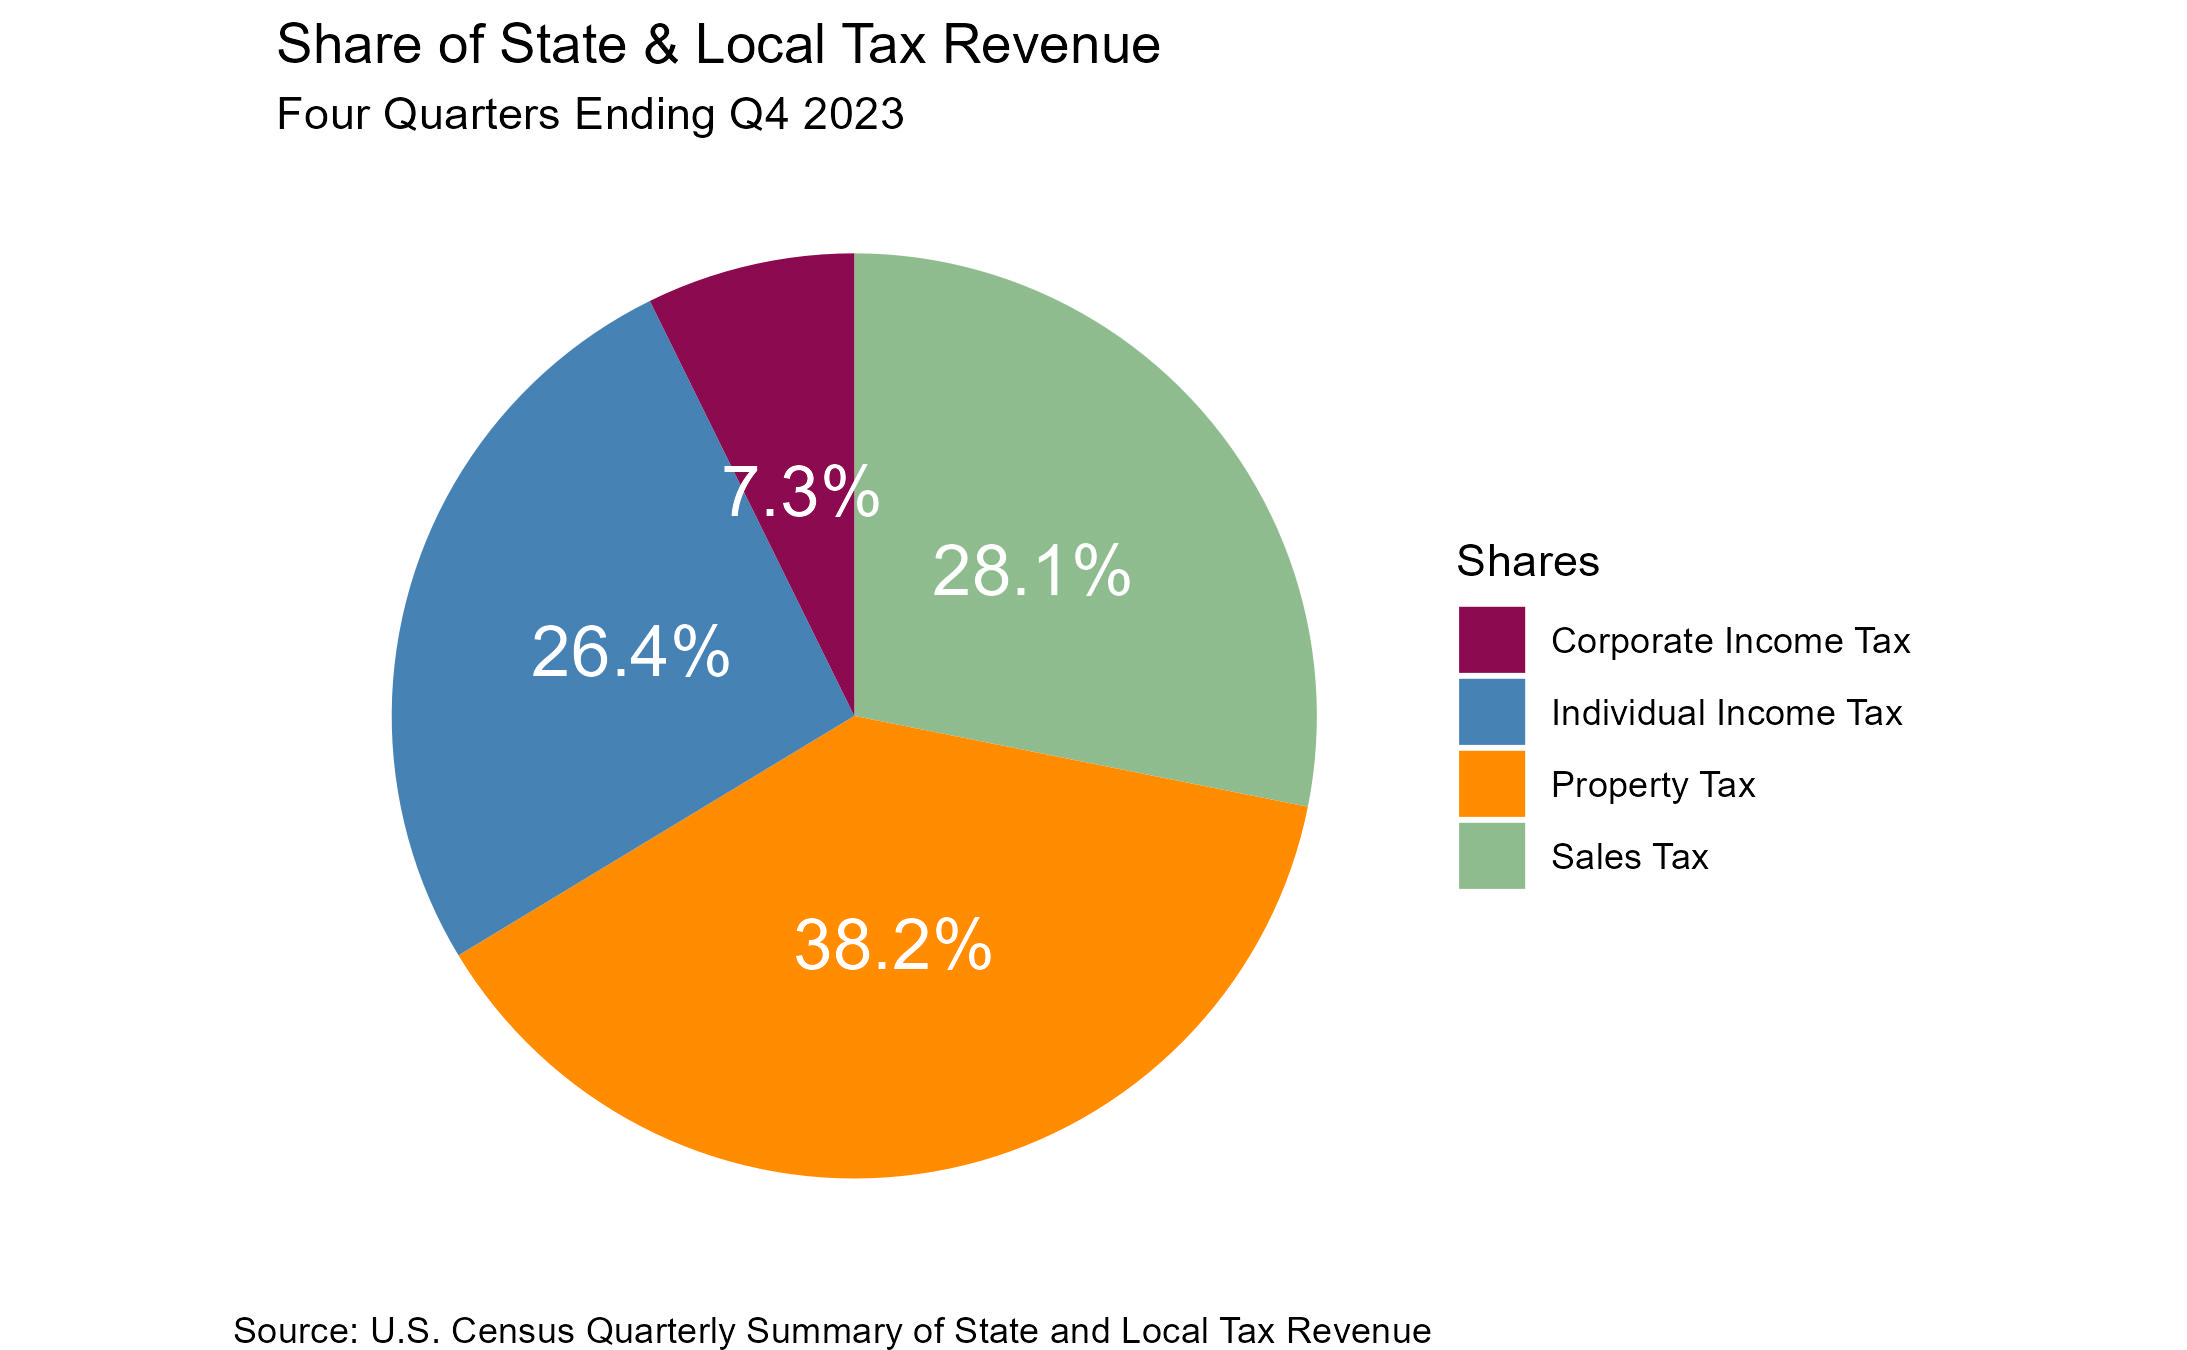
The property tax share of total state & local tax collections in the fourth quarter stood at 38.2%, level with the previous quarter. This share has been trending upward since the third quarter of 2022 when it was at 33.7%. Although we have seen a recent uptick, the data has shown an overall trending decline since 2012 when the share was at 43.8%.

Of total state & local government tax revenue, property tax made up the largest share, followed by sales tax at 28.1%, individual income tax represented 26.4% while corporate income tax made up the remaining 7.3% in the fourth quarter of 2023.

Non-property tax receipts including individual income, corporate income, and sales tax revenues, by nature, are much more sensitive to fluctuations in the business cycle and the accompanying changes in consumer spending (affecting sales tax revenues) and job availability (affecting aggregate income). In contrast, property tax collections have proven relatively stable, reflecting the long-run stability of tangible property values and the effects of lagging assessments and annual adjustments.
Discover more from Eye On Housing
Subscribe to get the latest posts to your email.

