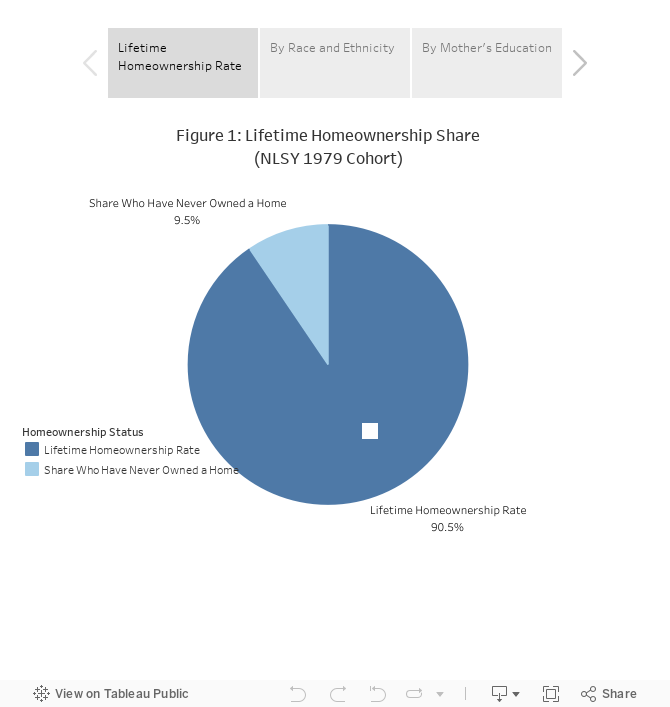
A recent NAHB Special Study uses the National Longitudinal Survey of Youth (NYLS) to study lifetime homeownership rates and how long individuals sustain in homeownership. The study finds a lifetime homeownership rate of 90.5% among the 1979 NLSY cohort, meaning that most people become homeowners at some point in life (Figure 1). This finding is a reminder of the importance of homeownership in terms of wealth accumulation and as a common aspiration among Americans.
Lifetime Homeownership Rates
Conducted by the US Bureau of Labor Statistics, the NLSY tracks the labor market activities and significant life events of surveyed individuals over time, starting in 1979 (when most were between the ages of 17 and 21) to 2016, the most recent year of data collection.
In contrast to the homeownership rate, which measures homeownership at a specific point in time, the lifetime homeownership rate, measures whether someone has been a homeowner at any point in their life. Studying the lifetime homeownership rate is useful as it captures people who move in and out of homeownership over time for various reasons. The NAHB special study approximates the lifetime homeownership rate by examining whether an individual in the NLSY 1979 cohort has been a homeowner at any point between 1980 and 2016.
Almost all of the NLSY 1979 sampled individuals have become homeowners at some point, but looking at differences by race and ethnicity shows that white individuals[1] have a higher lifetime homeownership rate (93.9%) than Hispanics (87.8%), and blacks (74.5%). The study also shows that individuals with mothers who have a high school degree or higher (92.7%) have a slightly higher lifetime homeownership rate than mothers who have less than a high school degree (88.5%), or who never attended high school (86.2%) (Figure 1, click through slideshow for other figures).
Homeownership Survival Rates
Using the NLSY also allows for the study of homeownership duration, or in other words, the shares of homeowners who remain in homeownership over time (Figure 2). Figure 2 shows the shares of individuals who have survived in homeownership by the year in which homeownership was first detected.
One finding from Figure 2 is that survival rates gradually improve as the NLSY cohort ages into their 30s. For example, those who start homeownership in 1980 are 23 at most in the sample, and just over half — 53% — survive in homeownership after eight years (1988). This is compared to an 88% survival rate after eight years among those who started in 1992 and who are mostly in their mid-30s.
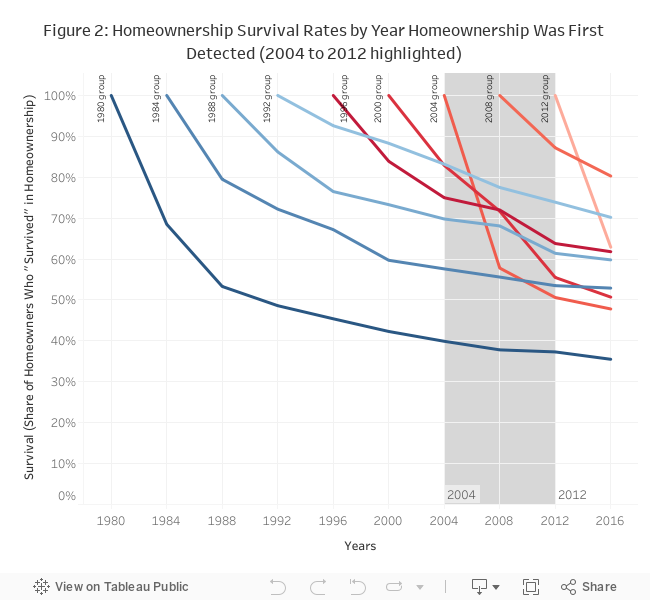
Another observation is that survival rates begin to fall after the 1992 start year, and the curves are particularly steep for the 2004 through 2012 start years. This is most likely the impact of the Great Recession. Groups that entered homeownership just prior to the Great Recession were most likely negatively affected as they bought homes at peak home prices and had less opportunity to build equity in their homes before the downturn, compared to groups that entered homeownership at earlier dates.
For more information on NLSY 1979 lifetime homeownership rates and survival rates, including homeownership survival rates by race and ethnicity, please click here to access the NAHB Special Study.
[1] The NLSY codes uses three race/ethnicity codes: black, Hispanic; and non-black/non-Hispanic. NAHB analysis of the 2017 American Community Survey (1 year) shows that a majority of non-black, non-Hispanic homeowners – 83 percent — are white. Therefore, for the purposes of this survey the non-black, non-Hispanic homeowners will be referred to as white homeowners.
Discover more from Eye On Housing
Subscribe to get the latest posts to your email.