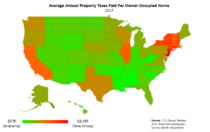
Property taxes vary widely across states both in terms of annual taxes paid as well as effective tax rates. In 2017, the difference between average real estate taxes paid by New Jersey and Alabama home owners was nearly $8,000. New Jersey continued its perennial distinction as having the highest average real estate tax bill per home owner ($8,485) as well as the highest effective tax rate (2.13%). Alabama ($684) and Hawaii (0.30%) were at the other end of the spectrum, boasting the lowest average effective tax rate and annual real estate tax bill, respectively. The difference between the highest-taxed state (New Jersey) and lowest (Alabama) grew by $100 in 2017.
These figures include real estate taxes levied by state and local governments, but the extent to which each level of government depends on property tax revenues is vastly different. Only two percent of state tax revenue comes from property taxes while the comparable figure for local governments is over 70%.
However, those property tax collections come from taxes levied on business property in addition to owner-occupied real estate taxes. The share of property tax revenue derived from these real estate taxes ranges from 16.1% in Wyoming to 60.1% in New Jersey.
Real Estate Taxes Paid by Home Owners
The overall distribution has remained roughly unchanged since 2016, as the order of the top five and composition of the top ten remained the same. The map below illustrates the concentration of high average property tax bills in the Northeast. In contrast, with the exception of Texas, southern states boast some of the lowest RET bills for their resident homeowners.

As property values vary widely by state, controlling for this variable produces a more instructive state-by-state comparison. In keeping with prior analyses, NAHB calculates this by dividing aggregate real estate taxes paid by the aggregate value of owner-occupied housing units within a state. The effective tax rate can be expressed either as a percentage of home value or as a dollar amount levied per $1,000 of this value.
The map below shows that New Jersey has the dubious distinction of imposing the highest effective property tax rate—2.13% or $21.34 per $1,000 of home value. Hawaii levies the lowest effective rate in the nation—0.30%, or $3.03 per $1,000 of value. However, this low rate combined with extremely high home values results in middle-of-the-pack per-homeowner property tax bills. At $692,938, the average home value in Hawaii is the highest in the country and 50 % higher than New York’s average home value ($460,075).

Interstate differences among home values explain some, but not all, of the variance in real estate tax bills across the country. Texas is an illustrative example of a state in which home values hardly, if at all, explain real estate tax bills faced by homeowners. While Texas ranks only 30th in the country for average home values, it is 11th in average real estate taxes paid. Other factors are clearly at play, and state and local government financing turns out to be a major one.
Role of Property Taxes in Government Budgets
According to 2017 data, property taxes accounted for nearly 40% of state and local tax receipts, on average. However, the data also illustrates that states rely much less heavily on property taxes as a source of revenue than do local governments.
While practically all local governments tax property in some way, just under three-quarters of state governments levy a property tax. State property tax revenue accounts for greater than five percent of tax collections in 11 states, while only three states—Vermont (33.8%), Wyoming (16.6%), and New Hampshire (16.2%)—have property tax collections that make up for more than 15% of their total tax receipts.
In contrast, property tax receipts made up nearly one-half of total local government revenue and over 70% of local governments’ tax revenue. Property taxes provide three-quarters or more of local own-source revenue in six states; Connecticut, Maine, Massachusetts, New Hampshire, New Jersey, and Rhode Island.
Residential Real Estate is Only Part of the Story
State and local property taxes tax more than just residential real estate. State and local governments also collect property taxes on commercial real estate, industrial real estate, and personal property owned by individuals as well as businesses.
Although the disaggregated figures are not separate line items in Census government finance surveys, the American Community Survey (ACS) data on real estate taxes paid by home owners provides a starting point. Dividing each state’s total state and local property tax collections by its corresponding real estate tax figure from the ACS yields the percentage of property taxes that comes from the taxation of owner-occupied homes. The map below shows the share of each state’s property tax revenue that came from taxing owner-occupied housing in 2016 (the most recent year for which the data are available).

Please visit the special study page to view the full report, Property Tax Rates, Bills, and Role in State Budgets.
******************
For state-specific data, see:
Average Real Estate Tax Bill – 2017
Effective Property Tax Rates – 2017
Residential Real Estate as a Share of Total Property Taxes -2016
Discover more from Eye On Housing
Subscribe to get the latest posts to your email.
Was born and raised in nj, lived in rockaway nj up until 1991 when I got transferred to tx. At this time I was paying 2000.00 per year on a 2000 quare foot home. would like to come back home but cannot afford the taxes or the price of homes.
That’s it I’m moving to Texas.